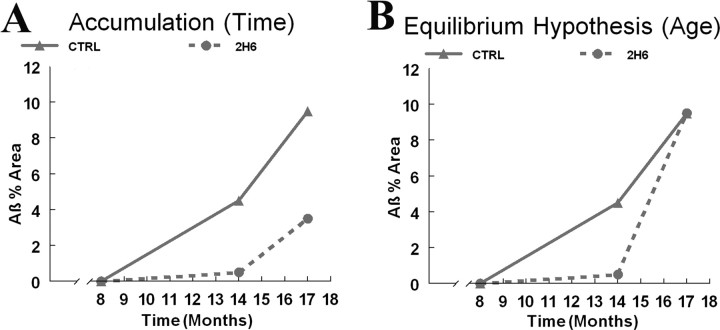
Figure 1.
Theoretical interpretation of Aβ accumulation based on the percentage area of total Aβ immunohistochemistry at 3 age points: 8, 14, and 17 months. The solid line in the figure represents the control group Aβ levels, and the dashed line represents the group treated with 2H6 for 6 months. A, The accumulation hypothesis. B, The equilibrium hypothesis.

