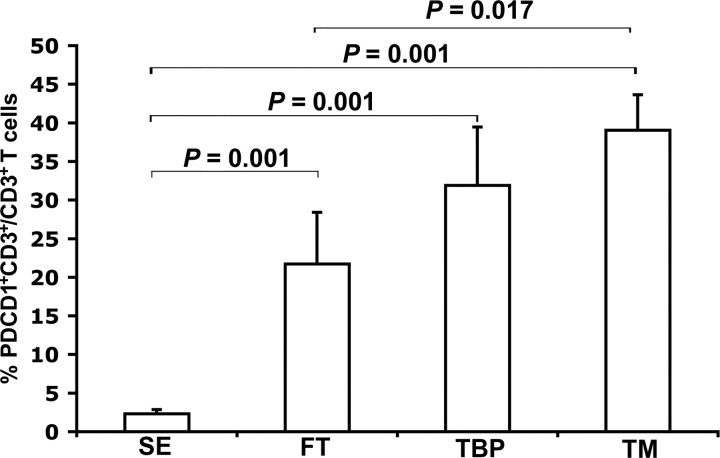
FIG. 2.
Quantification of PDCD1-expressing T cells in endometrial and decidual tissues. Graph represents mean percentages of PDCD1+CD3+ cells in each tissue type (SE, n = 6; FT, TBP, and TM, n = 7/group). Error bars indicate SEM. SE, Secretory endometrium; FT, first-trimester decidua; TBP, term basal plate; TM, term extraplacental membranes. Comparisons for which no P value is given were not significantly different (P > 0.05).

