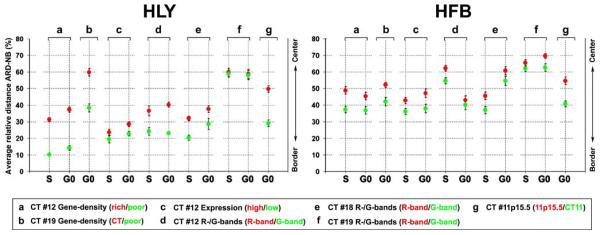
Fig. 2.
Average relative distances of differently assigned BAC pools to the nuclear border (ARD-NB) of Hly and Hfb. Red dots represent gene-dense regions, highly expressed genes, or R-band-assigned chromatin respectively; green dots represent the respective gene-poor regions, weakly expressed/silent genes, or G-band-assigned chromatin and CT11 hybridized together in the different experiments. The differently assigned pairs of pools compared within one experiment show for all series smaller ARD-NBs for the green dots compared to the respective red dots

