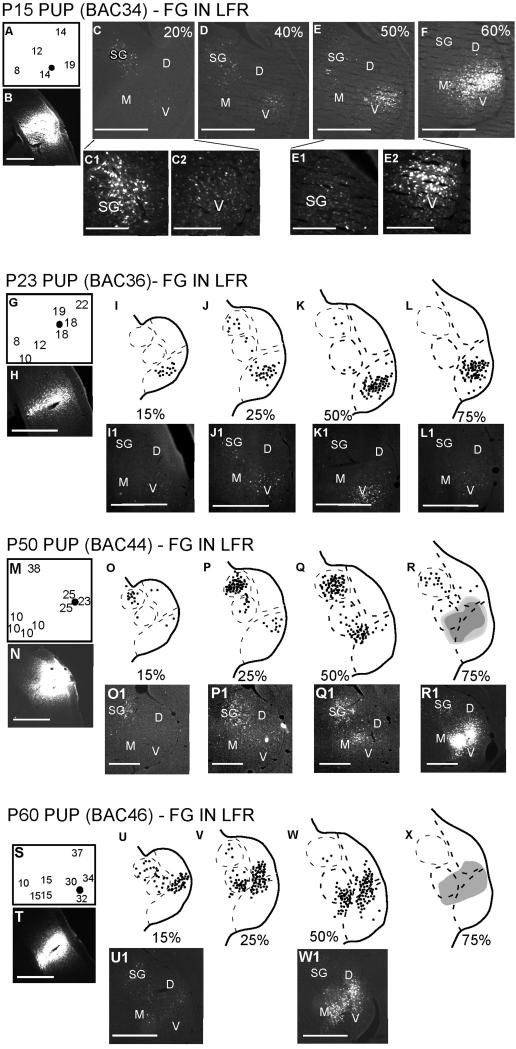
Figure 2.
Both SG and MGBv are labeled following injections in the LFR of the cortex. Four different experiments are shown. (A, G, M, S) Best frequency map around the cortical injection site (black dot). Note that all injections were made near neurons with BF<35 kHz. These neurons were selective for noise used in prey localization. (B, H, N, T) Cortical injection sites. For each experiment, the locations of labeled neurons in four different sections of the MGB are shown in a caudal to rostral direction. In the schematic representation of the MGB, each dot represents one or two neurons. A solid shape is used if the labeling is dense (e.g., R, X). Scale bars = 500 μm in all figures, except in C1, C2, E1, E2, where the scale bar = 200 μm.

