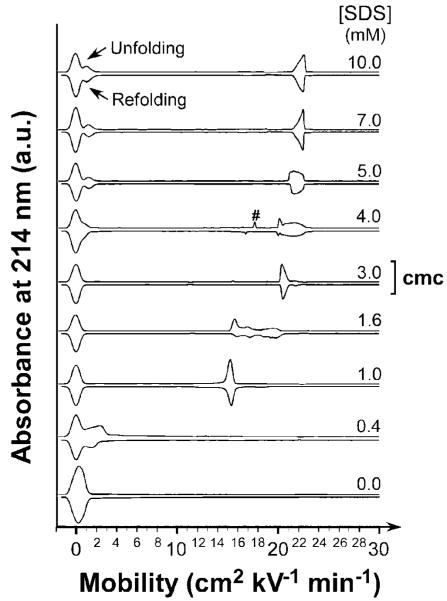
Figure 3.
CE traces demonstrating reversibility and equilibrium. Electro-pherograms of UBI-SDSn complexes obtained after dialyzing native (N) and SDS-denatured UBI (D, incubated in 10 mM of SDS in tris-glycine buffer for 170 h prior refolding) against tris-glycine buffer containing different concentrations of SDS over 170 h. “Unfolding” experiments correspond to the dialysis of native UBI against higher SDS concentration, and “Refolding” experiments correspond to dialysis of unfolded/denatured UBI (initially in 10 mM SDS) against lower concentrations of SDS. The peak marked (#) was an artifact. Electropherograms were mirrored across the x-axis to facilitate comparison.

