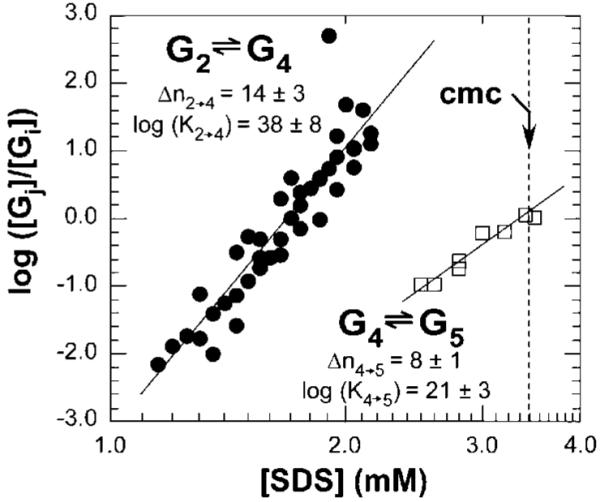
Figure 5.

Plot of log([G4]/[G2]) and log([G5]/[G4]) vs log [SDS] for four sets of experiments for the transition G2→G4 (●) and two sets for the transition G4→G5 (□), where [G2], [G4], and [G5] are the relative concentrations of all UBI-SDSn complexes within their respective groups. Values Δni→j correspond to the number of SDS molecules involved for the transition from Gi to Gj (i and j represent the label of the group). For example, in the transition from G2 to G4, the value Δni→j corresponds to the number of SDS that bind G2 to yield G4, and Ki→j refers to the thermodynamic equilibrium constant for this transition (Ki→j has units of (mol/L)-Δni→j). Relative concentrations were determined by integrating electropherograms in the mobility range attributed to each group (integration was performed as a function of time, t). We fitted the data to the linearized expressions of the law of mass action described in eqs 5 and 6. The errors ((±) correspond to half of the amplitude between the highest and lowest values of the slope and y-intercept fitting the data points.
