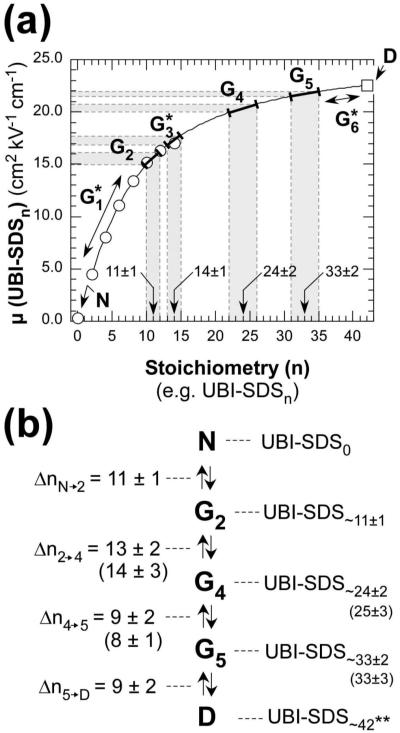
Figure 6.
Extrapolation of mobilities of charge ladders for the determination of the stoichiometry n of UBI-SDSn complexes within each group of complexes. (a) The electrophoretic mobilities of the rungs of the 4-sulfophenylisothiocyanate charge ladder (μn) corrected by the factor defined in eq 4 are represented by (○) and are plotted versus n (e.g., the number of SDS molecules bound to UBI). The SDS-saturated UBI (□, 0) is represented in this plot at n = 42.51 Data points (○) and (□) were fitted from n = 2 to n = 42 with a log-normal algorithm (e.g., μ(n) = μ0 + A exp(-(ln(n/n0)/k)2), with μ0 = 25.0, A = -21.4, n0 = 1.25, and k = 2.39; β2 = 0.16). The result of the fit is represented by the plain line. Each group of UBI-SDSn complexes, within its mobility range, was highlighted in gray and the corresponding number of SDS was included on the plot (indicated by arrows). (b) Summary of the stoichiometries of UBI-SDSn complexes within each group according to the extrapolated charge ladder (in parentheses: number of SDS molecules obtained by the equilibrium analysis described in Figure 5).

