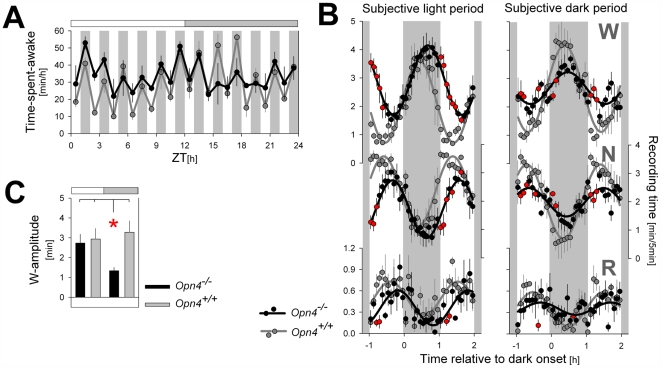
Figure 2. Direct effects of 1-h light (L) and 1-h dark (D) pulses on the sleep–wake distribution under a LD 1∶1 schedule.
(A) Hourly mean values of wakefulness during the LD 1∶1 cycle. Hourly L pulses suppressed wakefulness, but this effect seemed to vary with time of day in Opn4−/− mice and was especially small between ZT15 and ZT21. Grey horizontal bars mark the subjective dark period (i.e., the 12-h dark period of the preceding days under LD 12∶12). (B) Average time course of the LD-induced changes in wakefulness (W; upper), NREM sleep (N; middle), and REM sleep (R; lower panels) during the 12-h subjective light (left) and subjective dark (right) period. Values represent means (±SEM) over 5-min intervals in the hour preceding, during, and following the six 1-h dark pulses in the subjective light and dark periods, respectively. A three-way ANOVA with factors “genotype,” “time of day” (subjective light versus subjective dark period), and “time course” (5-min values) revealed that for W and N, time course was significantly affected by time of day and genotype (interactions: genotype×time of day: W and N: p<0.0001; R: p = 0.017; genotype×time course: W and N: p<0.0001; R: p = 0.14; time of day×time course: W: p = 0.019; N: p = 0.048; R: p = 0.18). Red filled circles denote 5-min intervals with significant genotype effects (p<0.05; post hoc t-tests). Black (Opn4−/−) and grey (Opn4+/+) sine waves represent best fits to the data points. (C) Changes in the time course observed in (B) were summarized and quantified by determining the amplitude of sine waves of best fit for each individual mouse (see Text S1 for details). The thus estimated amplitude of the LD-induced changes in wakefulness was affected by time of day (two-way ANOVA interaction genotype×time of day p = 0.033) and was significantly smaller in Opn4−/− mice during the subjective dark period compared to the subjective light period and compared to the values obtained in wild-type mice in both conditions (red asterisk; post hoc t-tests; p<0.05).

