Fig. 3.
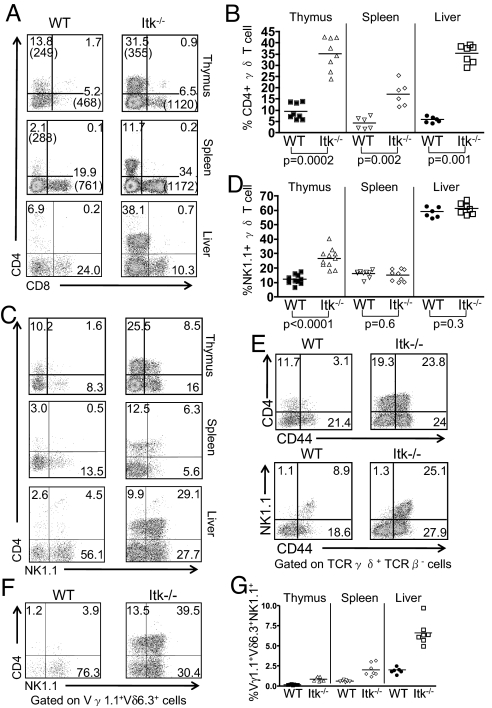
Altered γδ T cell subsets in the spleen and thymus of Itk−/− mice. Cells were prepared from thymus, spleen, and liver of WT and Itk−/− mice and analyzed by flow cytometry. (A) CD4 vs. CD8 expression on gated TCRδ+TCRβ− cells. The percentages of each subpopulation are indicated, and the mean fluorescence intensities are shown in parentheses. (B) The percentages of CD4+TCRδ+ cells in the thymus, spleen, and liver are shown. (C) CD4 vs. NK1.1 expression on gated TCRδ+TCRβ− cells in the thymus, spleen, and liver. (D) The percentages of NK1.1+TCRδ+ cells in the thymus, spleen, and liver. (E) Thymic TCRδ+TCRβ− cells were analyzed for CD44 vs. CD4 (top) or NK1.1 (bottom) expression. Data are representative of two independent experiments. (F) TCRδ+TCRβ− cells from the liver were analyzed for Vγ1.1, Vδ6.3, NK1.1, and CD4 expression. Dot-plots show NK1.1 vs. CD4 expression on gated Vγ1.1+Vδ6.3+ cells. (G) The percentages of total cells in the thymus, spleen, and liver that represent the Vγ1.1+Vδ6.3+NK1.1+ subset were calculated. Differences between the WT and Itk−/− were statistically significant (thymus, P = 0.0006; spleen, P = 0.0006; liver, P = 0.001).

