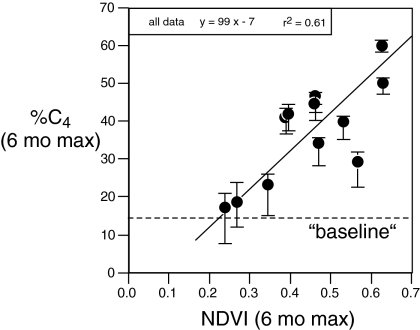
Fig. 3.
Correlation between maximum NDVI and maximum percentage of C4 biomass calculated in diet for 6-month time intervals from 2001 to 2006; reduced major axis (RMA) used to calculate regression. Time intervals were from 1 March to 1 September and from 1 September to 1 March, so as to differentiate the “long” and “short” rains, respectively (usually April–May and November–December). The solid line is for all data and vertical bars show the total range of calculated diets, using the 3 end-member mixing values discussed in Diet history of Royals Family.

