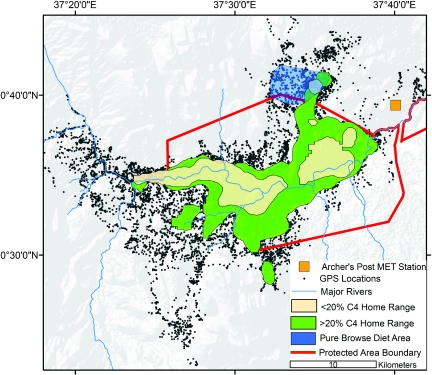
Fig. 6.
Regional map displaying GPS positions (black dots) collected from M4 and M5 in and around the national reserves (red polygon overlayed on a digital elevation map) during the 6-year study. The 95% kernel home range (42) retracted to areas in close proximity of the permanent Ewaso N′giro river (blue line) during dry season periods when diets were <20% grass (beige polygon), whereas ranges expanded to regions further from the river as the proportion of grass increased (green polygon). The only period when diets were 100% browse (blue polygon) occurred north of the protected area boundary in a heavily grazed community conservation region.

