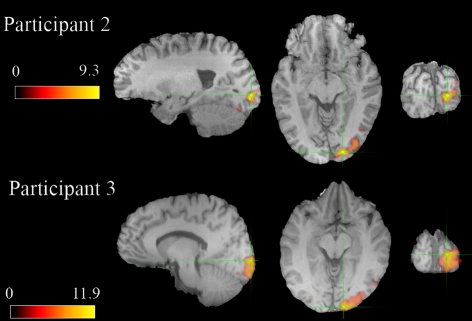
Fig. 3.
Statistically thresholded (P < 0.05, corrected) BOLD activation for the 2 representative participants in Figs. 1 and 2 shown in sagittal, axial, and coronal views. Units are z scores. The green crosshair indicates the voxel with the maximum BOLD response. Similar maps for all participants can be found in Fig. S3.

