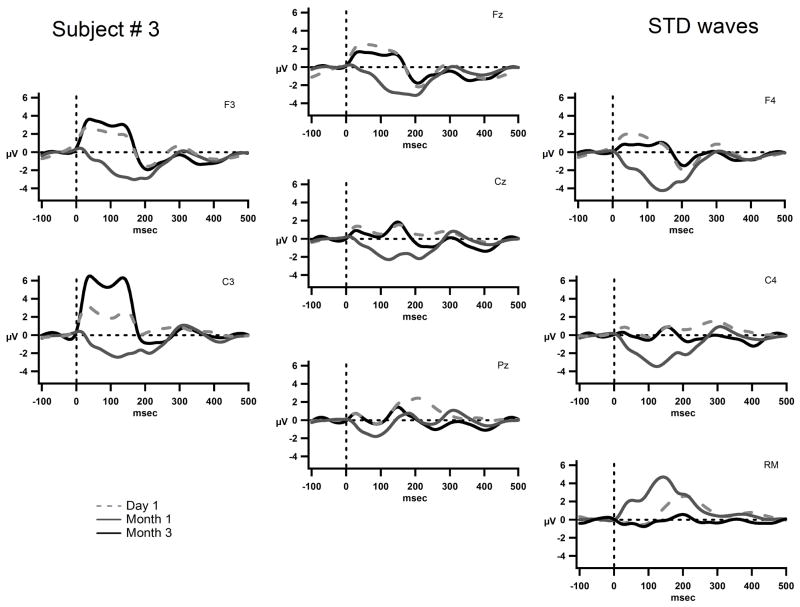
Figure 4.
The grand-mean AEP waves to the standard tone are displayed for electrodes Fz, Cz, Pz, F3, F4, C3, C4, and the right mastoid (RM) for S3 on on Day 1, (dashed gray line) Month 1, (solid gray line) and Month 3 (solid black line). The x-axis represents time in milliseconds and the y-axis represents amplitude in micro volts. The scale is the same as in figures 3 and 5. S3’s implant is on the left and thus there is a positive square wave seen most prominently at F3 and C3.

