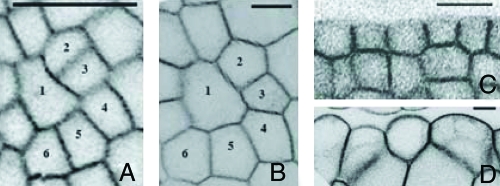
Fig. 3.
Sections showing the evolution of the shape of individual cells of the apex of Fig. 2. A and C correspond to time t = 0 immediately before the oryzalin treatment, whereas B and D correspond to t = 72 h. To allow a better comparison of the cell shapes, B and D have been scaled down by a factor of 2.5. (Scale bar, 10 μm.) A and B show sections parallel to the surface of the same cells of the meristem. At time t = 0, the two walls separating cells 2 and 3 and cells 5 and 6 had been recently formed. These new cell walls connect to the existing ones approximately at right angles; 72 h later, all the angles of these vertices have relaxed to 120°. C and D show the evolution of the L1 layer on two transverse sections of a primordium at time t = 0 and t = 72 h. On the latter image, the outer cell walls exhibit a larger outward curvature.

