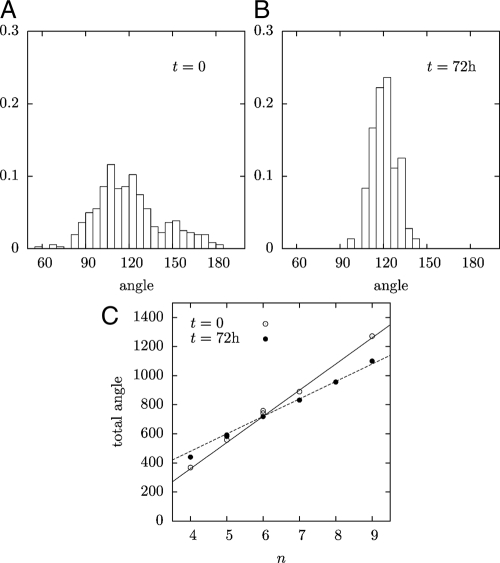
Fig. 4.
Geometry of the meristem. (A,B) Histograms of the angles at the vertices of the L1 cellular layer for t = 0, and t = 72 h. (C) Sum of all the angles of a cell versus the number of its edges. Solid line, (n − 2) × 180° corresponding to straight walls and a polygonal cell; dotted line, n × 120° corresponding to curved walls and all vertex angles equal to 120°.

