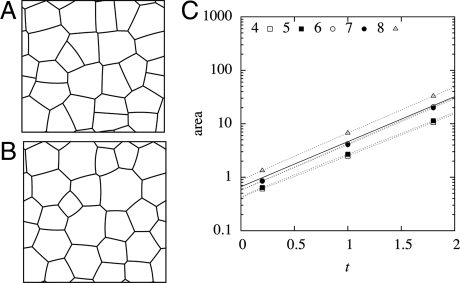
Fig. 7.
Simulation of growth with regulated turgor pressure—cell walls may be curved. (A) Normal growth of a 2D cellular structure giving the initial state at t = 0 when cell divisions become inhibited (dimensions of simulation box ≈4.2 × 3.9). (B) The 2D cellular structure resulting from the same simulation at time t = 2 after the inhibition of cell divisions (dimensions ≈29 × 28); cells with <6 sides become convex, and cells with more sides become concave. (C) Cell area versus time; dotted lines correspond to individual cells having different numbers of sides, the solid line to an average over all cells.

