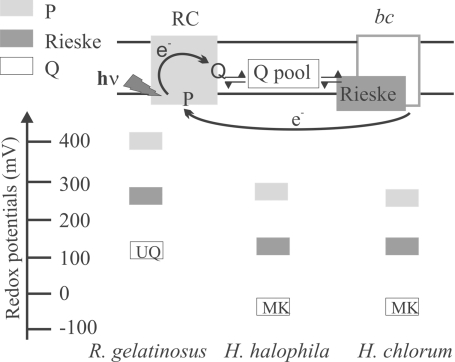
Fig. 2.
Schematic comparison of the redox properties of selected cofactors in the RC and the cyt bc1 complex from H. halophila (this work) to the corresponding values in photosynthetic chains from other species based either on UQ- [exemplified by Rubrivivax gelatinosus (11, 36)] or MK- [represented by Heliobacillus chlorum (11, 23)] pools. The rectangles indicate the redox midpoint potentials of the respective cofactors on a redox scale.

