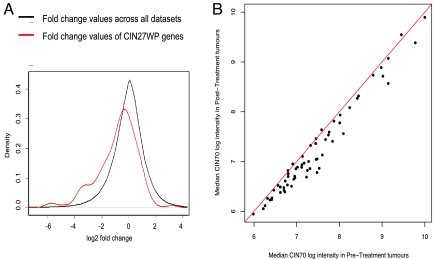
Fig. 1.
Genes overexpressed in tumors with CIN are repressed by MTS treatment in vitro and in vivo. (A) The CIN27wp gene expression signature, which correlates with total functional aneuploidy in several cancer types (9), was analyzed in 5 gene expression data sets measuring response to MTS treatment. The distribution of changes induced by MTS was lower in the CIN27wp genes (red) compared with the set of all measured genes (black) (P = 3.3e-7). (B) As part of the OV01 clinical trial, expression profiling was performed on ovarian carcinomas before and after 3 cycles of paclitaxel (Px) treatment. For each gene in the CIN70 signature, the median expression in the pretreatment and posttreatment tumors was compared, with the red line indicating equivalence.

