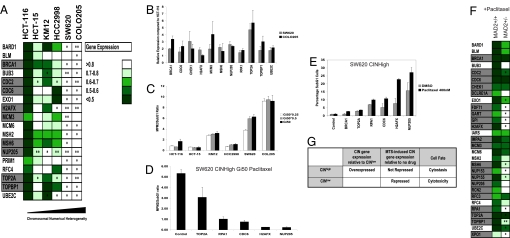
Fig. 3.
Paclitaxel cytotoxicity is associated with CIN-survival gene repression. (A) Quantification of gene repression following paclitaxel treatment of cell lines with increasing chromosomal numerical heterogeneity. Fold change in gene expression post-paclitaxel treatment (24 h) relative to expression in vehicle control treated cells was determined by qPCR analysis (normalization to 18S and GAPDH) after 24 h of paclitaxel treatment (50% of the Gi50 concentration) in 3 biological replicate experiments in cell lines with increasing CIN. Color-coding represents the mean fold change in gene expression of 3 biological replicates relative to cells treated with vehicle alone + 1 SD. CIN-survival genes are highlighted in gray. Gene expression following paclitaxel treatment is compared with the HCT-116 cell line displaying the lowest CIN. The significance of the differences in gene expression were determined using the unpaired 2-sided Student t-test: *P <0.05; **P <0.005. (B) CIN-survival genes are relatively overexpressed in CINhigh COLO205 and SW620 cells compared with near-diploid CINlow HCT-116 cells. Shown is the relative quantification of gene expression normalized to 18S and GAPDH in COLO205 and SW620 cells compared with near-diploid HCT-116 cells. The graph indicates the mean fold change in gene expression compared with HCT-116 cells of 3 biological replicates (+ 1 SD). (C) Colorectal cancer cell lines with increasing chromosomal numerical heterogeneity uncouple mitotic arrest from cell death. Cell lines were treated with paclitaxel relative to the Gi50, Gi50/2, and Gi50/4 concentrations. Quantification of dying cells (subG1 fraction) and cells arrested in mitosis (MPM2-positive fraction) were assessed by FACS analysis. The MPM2:subG1 ratio was calculated by assessing the percentage of MPM2 positive cells relative to the percentage of subG1 cells following 24 h of paclitaxel treatment. The mean ratio of 3 independent experiments is presented (+1 SD). Cell lines are represented in ascending order of CIN status (21). (D and E) Silencing CIN-survival genes in the SW620 CINhigh cell line promotes cell death after 24 h of paclitaxel Gi50 treatment. At 48 h after transfection of CIN-survival siRNAs, SW620 cells were treated with paclitaxel for 24 h, and cells were prepared and analyzed as in C. In D, the mean MPM2:subG1 ratio of 2 independent experiments is presented (+ 1 SD). E shows that silencing of NUP205, H2AFX, CDC6, and RPA1 promoted a significant increase in subG1 cells after paclitaxel exposure compared with DMSO-treated cells (P <0.05; Student t-test). (F) Impaired repression of CIN-survival genes following paclitaxel treatment in an isogenic model of CIN. Quantification of gene repression by qPCR analysis of 21 CIN-survival genes following treatment of HCT-116 wild-type parental cells and isogenic Mad2+/- cells after 24 h of paclitaxel treatment (50 nM) normalized to 18s. Color-coding represents the mean fold repression + 1 SD from 3 biological replicates. P values indicate significantly greater gene repression in the HCT-116 parental cell line (Student 1-sided t-test). (G) CIN-survival gene repression correlates with cytotoxic response and stable tumor karyotype.

