Fig. 6.
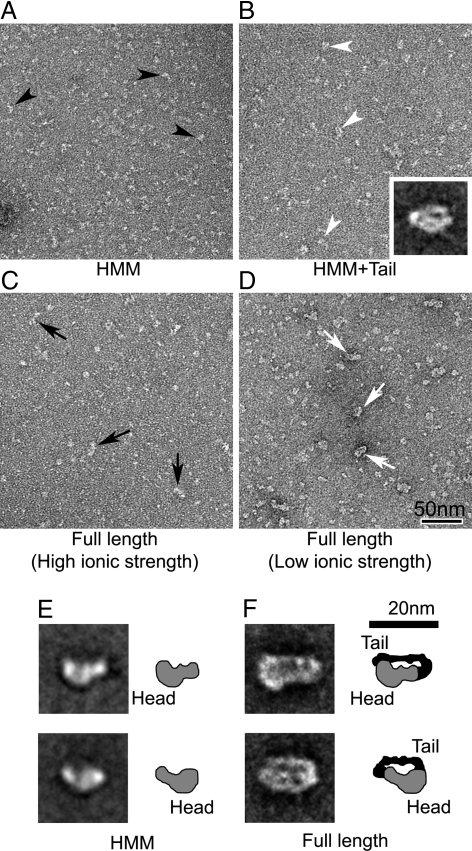
EM of DM7AHMM and DM7AFull in EGTA. (A and B) Negatively-stained fields of DM7AHMM in the absence and presence of the tail domain. Black and white arrowheads indicate individual HMM molecules and molecules interacting with the tail domain, respectively. (B Inset) Averaged image of head–tail interacting molecules (containing 37 individual images). (C and D) Fields of DM7AFull in 300 mM NaCl and 50 mM NaAcetate solution. Black and white arrows indicate the appearance of full-length molecules in the high and low ionic strength conditions, appearing narrower and wider, respectively. (E and F) Averaged images of HMM and full-length molecules (compare A and D, respectively). Averaged images in E show 2 different views (thought to represent molecules face-up and face-down on the carbon substrate), containing 104 images (Upper) and 80 images (Lower). Averaged images of full-length molecules in F, containing 21 images in each, were selected based on separation between the head and the tail domains in the closely-packed structures. Diagrams in E and F suggest possible interpretation of densities of the head (gray) and the tail domain (black), identified from the averages.

