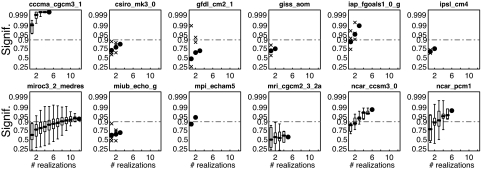
Fig. 1.
Statistical significance of the model JFM Tmin trend in the western U.S. (projected onto the anthropogenic fingerprint) as a function of the number of ensemble members included in the ensemble averaging. If the number of combinations of ensemble members for the indicated number of ensembles is 4 or more, whisker plots display the minimum value, 25th, 50th, and 75th percentiles, and the maximum value; otherwise, x's indicate the individual values and dots indicate the mean value.

