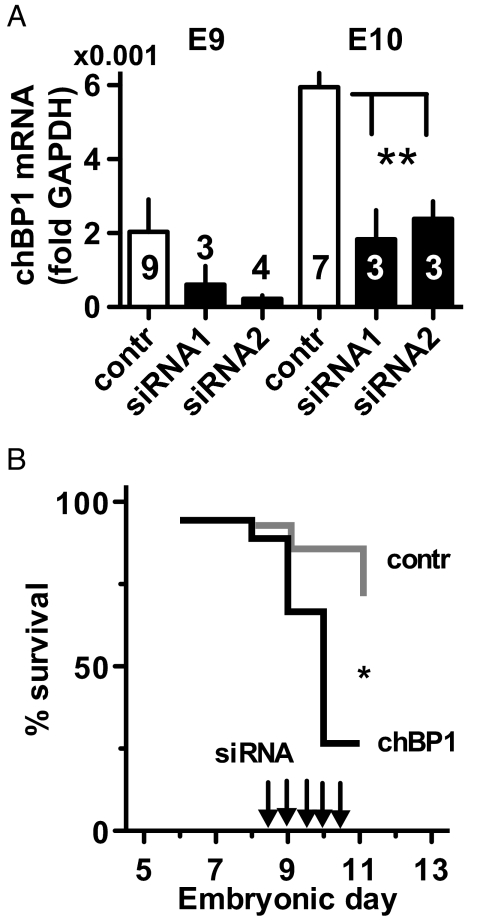
Fig. 7.
Effects of chBP1 knockdown. (A) Expression of chBP1 mRNA in chick embryos at E9 and E10 treated with control siRNA or with 2 different siRNAs targeted to chBP1 (see Materials and Methods). chBP1 mRNA was measured by qRT-PCR, and data are given relative to GAPDH. The number of embryos per group is indicated. **, P < 0.01. (B) Survival of chicks treated with chBP1-specific siRNA (n = 18) relative to control siRNA (n = 14). Arrows indicate siRNA injections. *, P = 0.017.

