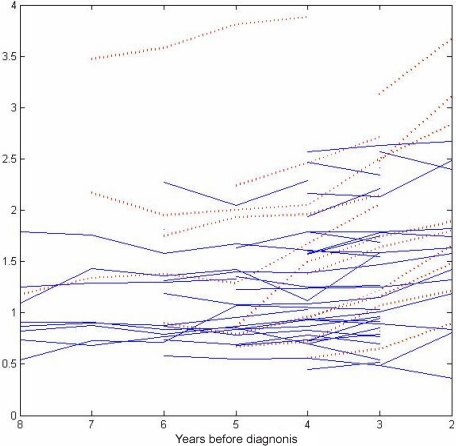
Figure 1.
M-protein concentration (g/dL) levels year by year prior to multiple myeloma diagnosis.* In approximately half the study population, the M-protein concentration levels showed a year-by-year increase prior to multiple myeloma diagnosis (red dashed line), whereas the other half maintained largely stable abnormal M-protein level up to the diagnosis of multiple myeloma (blue solid line). *Including all subjects with a quantifiable M-protein level.

