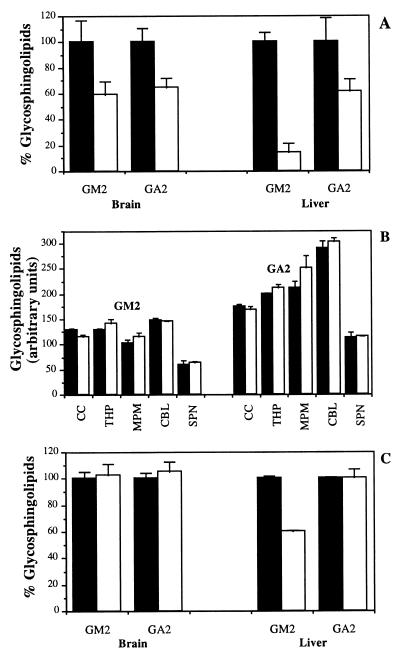
Figure 2.
(A) Graphical representation of HPTLC analysis of brain and liver GM2 and GA2 in Sandhoff mice in the presence or absence of NB-DNJ. Mice were treated from weaning at 3 weeks with 4,800 mg/kg per day of NB-DNJ, and GSL profiles were compared at 16 weeks of age relative to untreated age-matched controls. The HPTLC plates were analyzed by densitometry in relation to authentic GSL standards. (B) Graphical representation of HPTLC analysis of brain region GM2 and GA2 content at the end stage of untreated controls (125 days) and NB-DNJ-treated Sandhoff mice (170 days). CC, cerebral cortex; THP, thalamus/hypothalamus; MPM, midbrain, pons, and medulla; CBL, cerebellum; SPN, spinal cord. (C) Comparison of GM2 and GA2 levels in whole brain and liver at the end stage of diseases in untreated (125 days) and NB-DNJ-treated mice (170 days). The data are presented as the mean ± SD for three mice per group. Solid bars depict data from untreated mice, and open bars depict data from NB-DNJ-treated mice. Representative data are shown. The data set shown is from male mice, and comparable data were obtained from females (data not shown).

