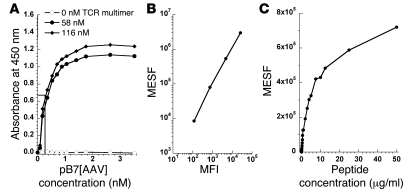
Figure 2. Estimation of TCR multimer binding affinity and limit of detection.
(A) TCR multimer was used to coat microtiter wells at 0 nM (open circles), 58 nM (filled circles), or 116 nM (filled diamonds). Biotinylated pB7[AAV] was then added at the indicated concentrations, followed by streptavidin-conjugated HRP. Absorbance at 450 nm was measured following addition of o-phenylenediamine substrate. Binding affinity (Kd) was estimated from the concentration of pB7[AAV] at which half-maximal detection occurred (EC50). (B) A set of APC calibration beads was used to set photomultiplier tube voltages on a FACS Canto II. Then, a calibration curve was generated using linear regression to calculate MESF from MFI (r2 ≥ 0.99). (C) After determining the MFI of peptide-pulsed HHL5-B7 hepatocytes stained with TCR multimer, the MESF was calculated and plotted against peptide concentration. The minimum number of pMHC complexes detectable by flow cytometry was estimated from the lowest MESF discernible from unpulsed cells.

