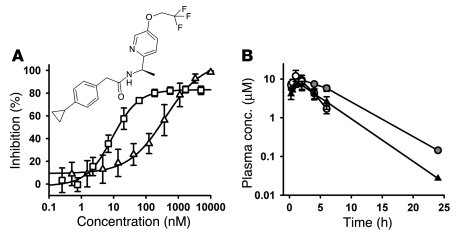
Figure 2. TTA-A2 structure, FLIPR potency, and rodent pharmacokinetics.
(A) Potency in hyperpolarized (open triangles) and depolarized (open squares) functional Ca2+ flux assays was determined as described previously (37). Potency is shown as the inflection point from a 4-parameter sigmoidal fit to the data. Data are mean ± SD (n = 7–8 replicates). P < 0.01 between groups, unpaired 2-tailed Student’s t test. Inset shows the structure of TTA-A2. (B) Exposure time course of TTA-A2 in rats (black triangles), lean mice (white circles), and obese mice (gray circles) after a 10-mg/kg dose by oral gavage. Data are mean ± SD (n = 3, except the 24-hour time points, for which 1 of 3 animals had detectable levels of TTA-A2).

