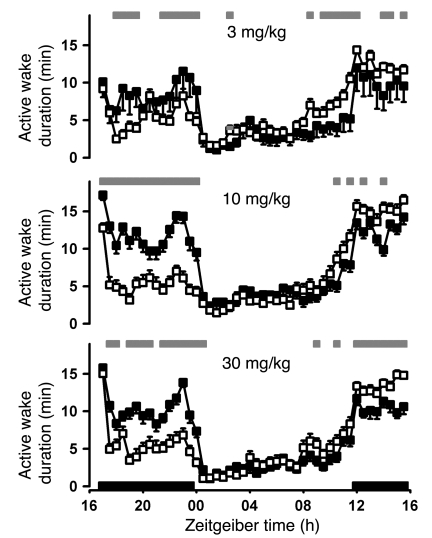
Figure 4. Effects of TTA-A2 on active wake duration when dosed during the active phase.
Sprague-Dawley rats (n = 8) were implanted with telemetry monitors and recorded in a 7-day crossover dosing paradigm and scored for sleep stage. TTA-A2 (open squares) or vehicle (0.5% methylcellulose, filled squares) was administered orally 5 hours after lights off. The results for all 8 animals were averaged by treatment over 7 administration nights, plotted on a 24-hour Zeitgeiber time scale, with lights-off periods indicated by black bars along the x axis, and compared by mixed ANOVA statistical analysis as described in Methods. Gray bars above denote significant differences (P < 0.05). Solid bars represent lights-off periods. Data are mean ± SEM.

