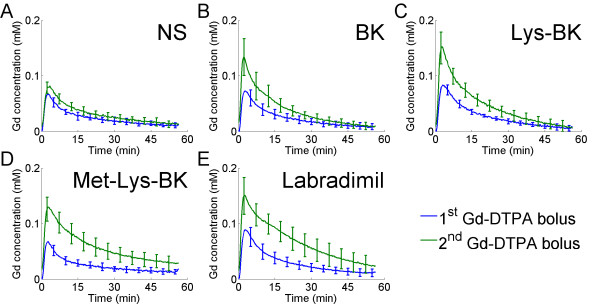
Figure 6.
Change in temporalis skeletal muscle tissue Gd concentrations of the 1st Gd-DTPA bolus versus of the 2nd Gd-DTPA bolus during 15 minute intravenous infusion of normal saline or respective bradykinin B2 agonist. (A) NS (N = 6), (B) BK (N = 8), (C) Lys-BK (N = 8), (D) Met-Lys-BK (N = 7), (E) Labradimil (N = 13). Error bars represent standard deviation.

