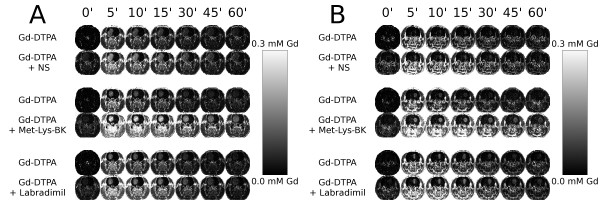
Figure 8.
Gd concentration maps over time of larger anterior brain RG-2 gliomas and smaller posterior brain RG-2 gliomas within a representative rat of the Normal Saline, Met-Lys-BK, and Labradimil groups. (A) Anterior brain gliomas: tumor volumes, 153 mm3 (NS), 127 mm3 (Met-Lys-BK), 102 mm3 (Labradimil); (B) Posterior brain gliomas: tumor volumes, 14 mm3 (NS), 51 mm3 (Met-Lys-BK), 35 mm3 (Labradimil). Note: Residual contrast in tissue prior to the 2nd Gd-DTPA bolus.

