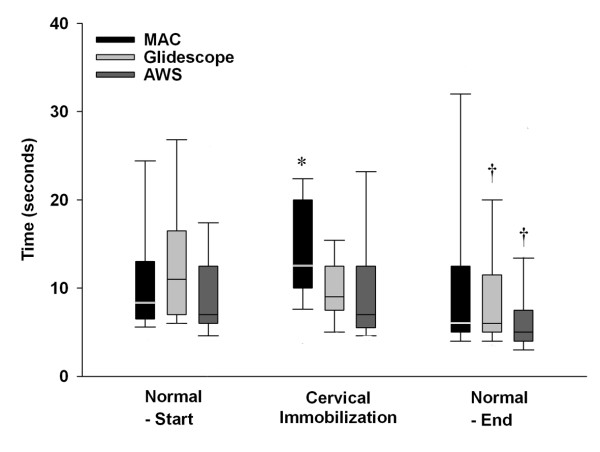
Figure 3.
Box plot representing the duration required to successfully intubate the trachea with each device in each scenario tested. The data are given as median and interquartile range, with the bars representing the 10th and 90th centile. * Indicates significantly different compared to both other Laryngoscopes. †Indicates significantly different from same device at the start of the protocol. Labels: Normal – Start: Intubation of the normal airway at the start of the protocol; Cervical Immobilization – Immobilization of the neck with hard collar; Normal – End: Intubation of the normal airway at the end of the protocol.

