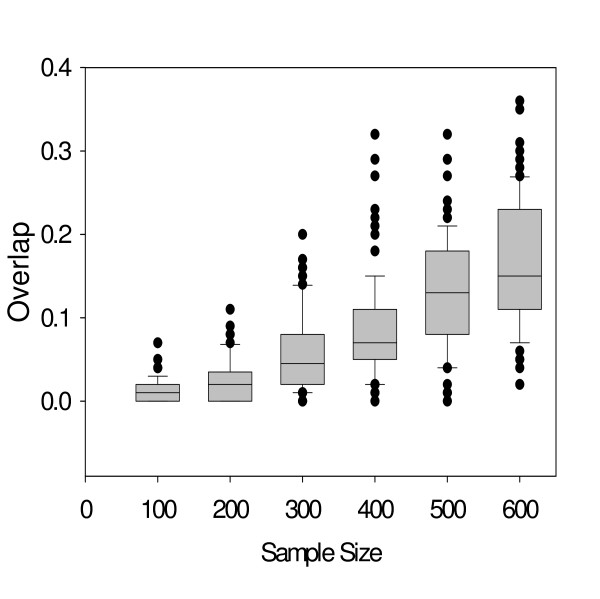
Figure 2.
An overlap between two prognostic gene-sets increases with an increasing sample size. From a data set of 1,372 samples, n samples were randomly selected and a prognostic gene set was prepared by selecting top 100 genes with the lowest p-value from Cox proportional hazard survival analysis. The sample size n was varied from 100 to 600 by an increment of 100, and the random sampling was performed 200 times for each sample size n. An overlap between two gene-sets was computed for each pair of 200 prognostic gene sets and the distribution of the overlaps was shown as boxplots.

