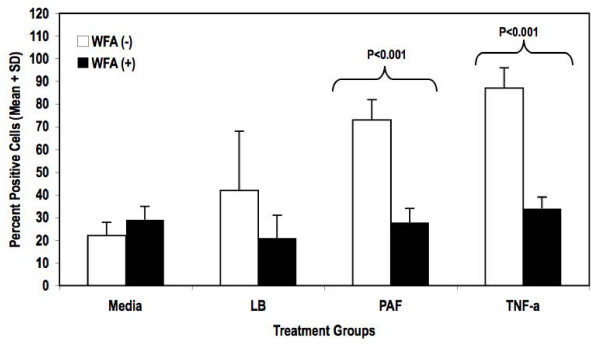
Figure 5.
Quantification of p65 translocation upon PAF stimulation and inhibition by WFA. Quantification of p65 translocation into nuclei of KKLEB cells under various test conditions was performed as described in "Findings". Treatment groups are as follows: Cells with media only (Media), cells treated with media containing LB Broth (LB), cells treated with 10% PAF (PAF), cells treated with 25 ng/ml TNF-α (TNF-α). All groups were either pre-treated with vehicle (WFA (-)) or with 3 μM WFA (WFA (+)). Data are reported as percent mean + standard deviation of cells scored as positive for p65 translocation. The treated sample groups were statistically different from untreated sample groups as determined using two-way ANOVA (p < 0.05). Pair-wise comparisons between groups were performed using Bonferroni post-tests. Statistical significance (if applicable) was noted on the figure. Statistical tests were performed using Prism software (GraphPad, La Jolla, CA).

