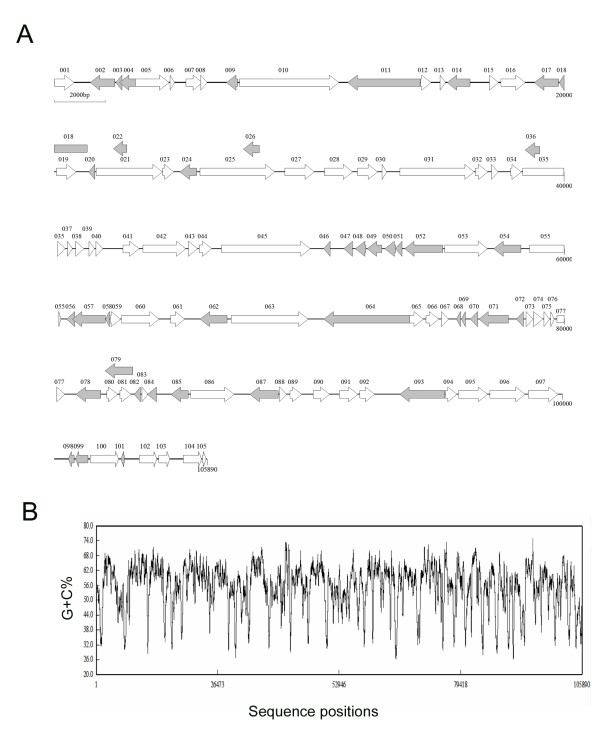
Figure 1.
Schematic organization of the STIV genome. (A) Linear predicted open reading frame (ORF) map of the STIV genome. Predicted ORFs are represented by arrows indicating the approximate size and the direction of transcription based on the position of methionine initiation and termination codons. White arrows represent ORFs in the forward strand, whereas gray arrows identify those in the complement strand. (B) The G+C content of STIV genome. The graphic representation was calculated using the plot option in DNAMAN program and a window of 200 nucleotides. The kilobase scale is shown below the G+C plot.

