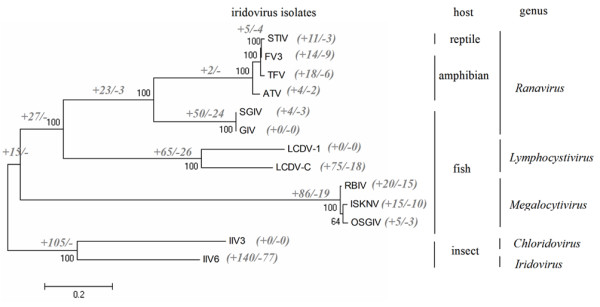
Figure 5.

Phylogeny of the iridovirus based on concatenated protein sequences and the gene gain and loss events. The host of the virus and the virus classification are indicated on the right. Bootstrap values are shown in black next to the nodes and the numbers of gene gain (+) and loss (--) events along each branch are indicated in grey.
