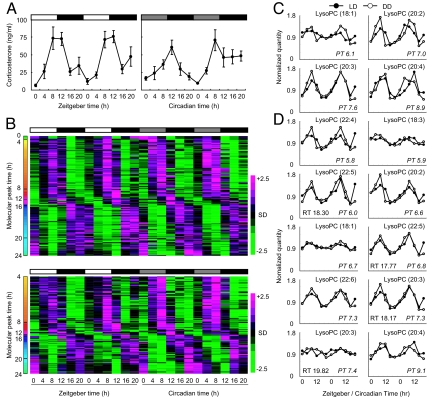
Fig. 1.
Circadian patterns of metabolites in mouse plasma. (A) Circadian changes in corticosterone levels in the plasma of CBA/N mice under LD (Left) and DD, Center) conditions. All values are mean ± SEM. The white bars above the graph indicate day, gray bars indicate subjective day, and black bars indicate night/subjective night. ZT0 is the time of light on, and CT0 is the time the light used to be turned on. (B) Circadian oscillatory metabolites in the plasma of CBA/N mice [negative ions (up); positive ions (down)]. On the heat maps, magenta tiles indicate a high quantity of substances and green tiles indicate a low quantity in plasma. Metabolites are sorted according to their molecular peak time (molecular peak times are indicated as colors). (C and D) Identified oscillatory peaks measured by negative ion mode (C) and positive ion mode (D). Mean value was set to 1.0.

