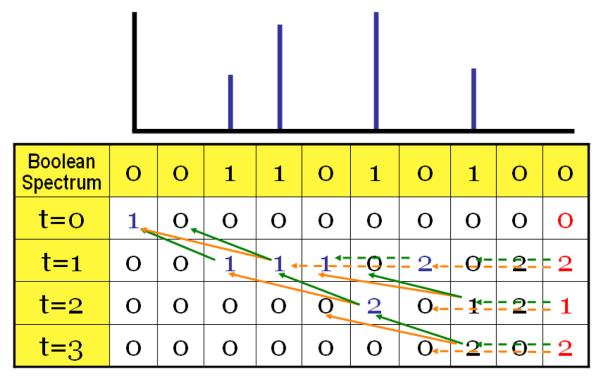
Figure 2. Illustration of the dynamic programming algorithm for computing the generating function.
The MS-GF dynamic programming algorithm is illustrated with the help of a simplified amino acid model (only two amino acids A and B with masses 2 and 3 Daltons respectively) and a simplified discretized spectrum (only 4 peaks at 2,3, 5, and 7 Da). The scoring function used for this illustration is the number of matching prefix ions. The spectrum is converted into its boolean representation 011010100 with 1s at positions 2,3,5, and 7 (extra zero in the beginning is added to represent the variable x(0, t)). The vertical axis in the dynamic programming table represents scores (t). The value in each cell of the matrix represents the number of peptide reconstructions that explain the initial part of the spectrum till that position with the corresponding score. The first cell in the matrix (0,0) is initialized with 1, and the matrix is filled progressively from left to right and top to bottom. The value of each cell is computed as the sum of the values of previously filled cells which are 2 (green arrow) or 3 (orange arrows) columns before the cell under consideration. If there is a peak at the current position of the spectrum, sum is taken over the cells in the previous row, otherwise in the same row. In this example, the maximum achievable score (t) is 3, which can be obtained by two peptide reconstructions. The sequences of these reconstructions can be obtained by backtracking, as indicated by the arrows, and are found to be ABAA and BAAA. We also see that there are 2 reconstructions with score 1 and 1 reconstruction with a score of 2.

