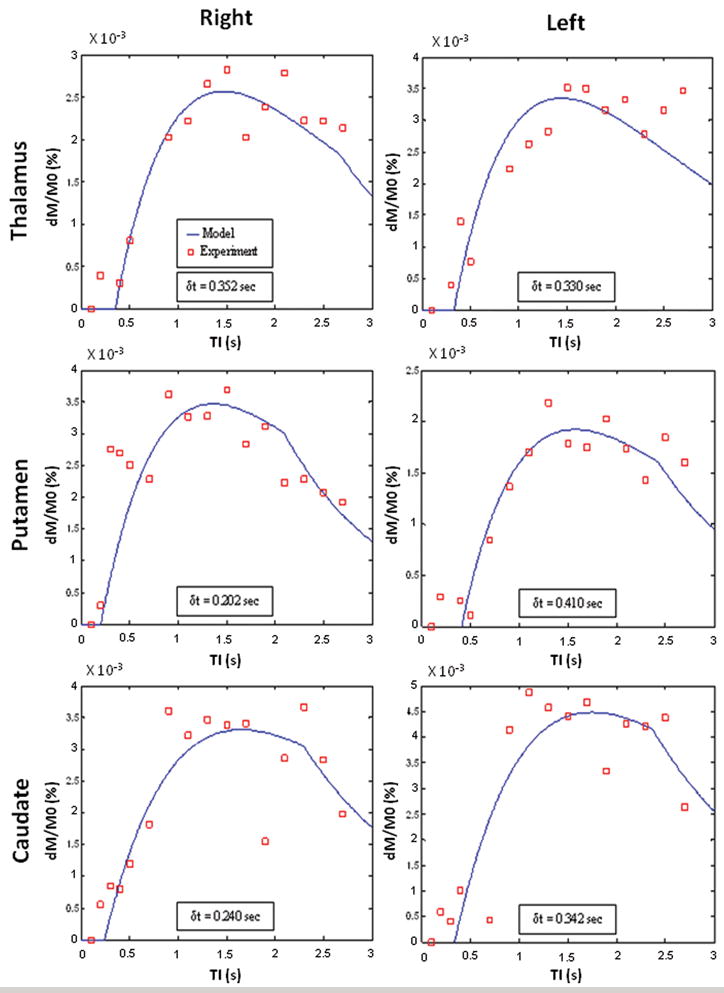
Figure 4.

Segmented true FISP ASL signal differences measured at different TIs (squares) in a healthy subject for each of the six ROIs identified in Fig. 2a and b compared to theoretical curves (lines) that were generated using a least squares best fit based on the model of Buxton et al. (30). The theoretical plot for each ROI was also used to calculate its arterial transit delay time (δt).
