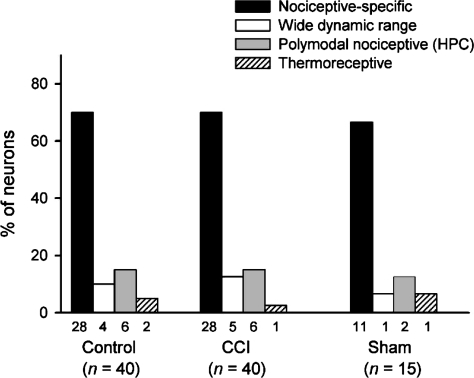
Figure 3. Frequency distribution of different functional classes of lamina I spinoparabrachial neurons in control, CCI and sham-operated animals.
Each neuron isolated was classified using cutaneous stimuli of different modalities (see Methods). The bars show the frequency distribution of the 4 classes of lamina I spinoparabrachial neurons in the three groups of animals studied. There were no significant differences between groups (P > 0.3, χ2 test).

