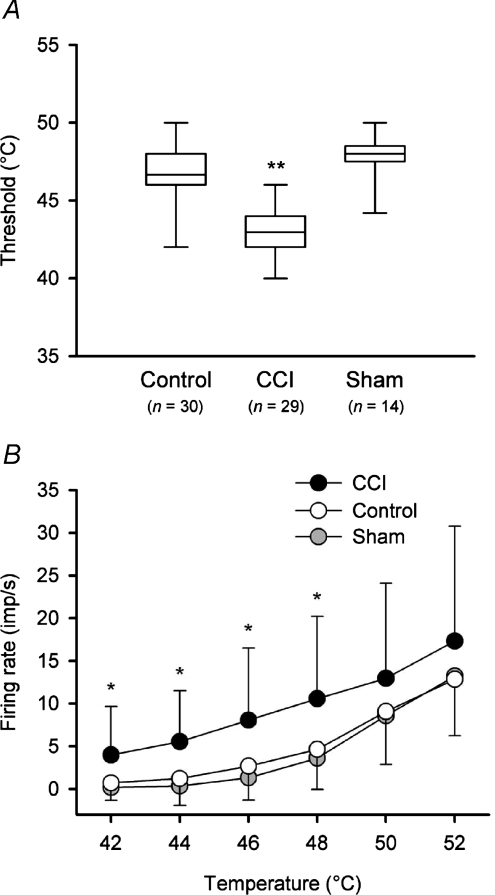
Figure 7. Quantitative differences in neuronal heat encoding in animals with a CCI.
A, box plots of heat thresholds of nociceptive neurons in each of the control, CCI and sham-operated groups. The horizontal line within the box is the median value, the box boundaries are the 25th and 75th percentiles and the bars indicate the data range. Thresholds were significantly lower in animals with a CCI (P < 10−4, ANOVA; asterisks) compared to both control and sham-operated rats. B, stimulus–response curves (mean ± 1 s.d.) of heat encoding by neurons in controls, CCI rats and sham-operated animals. Neurons in animals with a CCI were significantly more responsive to temperatures in the range 42–48°C (P < 0.003; 2-factor ANOVA followed by Tukey's post hoc test; asterisks).

