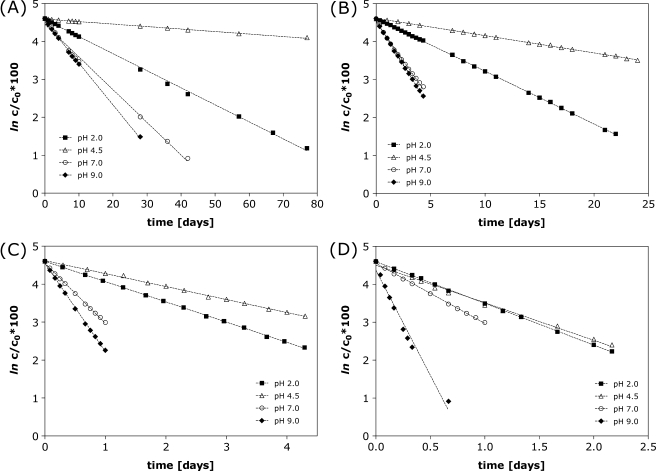
Fig. 2.
Degradation of oxytocin over time at 40°C (A), 55°C (B), 70°C (C) and 80°C (D) for formulations with 0.1 mg/ml oxytocin at pH 2.0, 4.5, 7.0 and 9.0 determined by RP-HPLC. Linear fitting (where r2 > 0.99) showed the first order kinetics, with the slope of the resulting straight lines representing the degradation rate constant, kobs.

