
Figure 9.
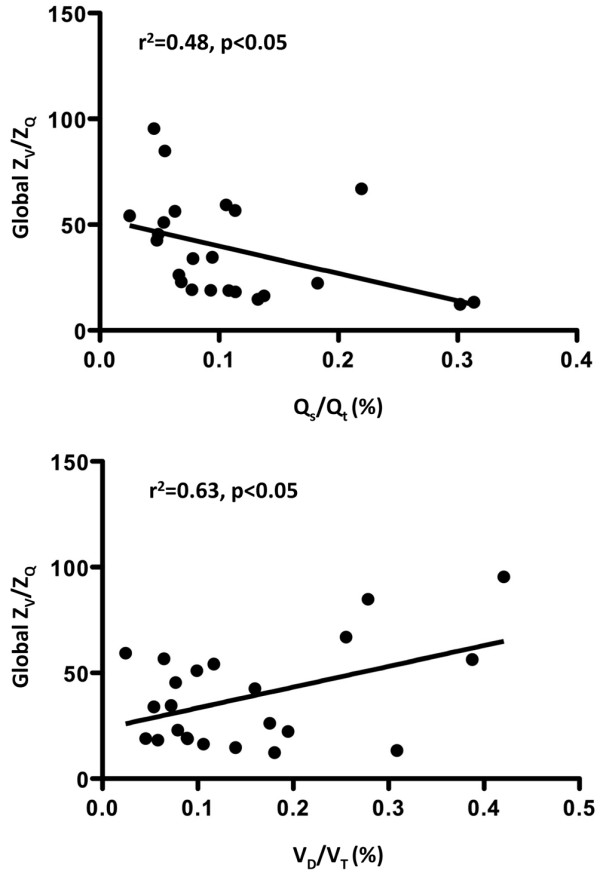
Linear regression plots for the global ZV/ZQ ratio versus the Qs/Qt (top) or the VD/VT (bottom). Qs/Qt = venous admixture; VD/VT = fractional dead space; ZQ = perfusion-induced change in thoracic impedance; ZV = ventilation-induced change in thoracic impedance.