
Figure 4.
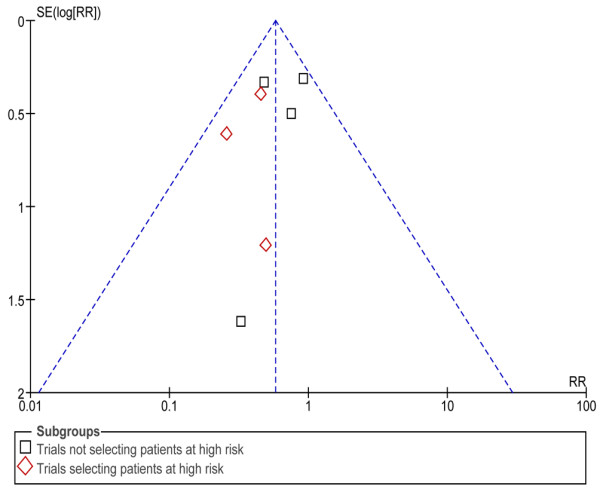
Funnel plot for outcome reintubation to detect bias or systematic heterogeneity in trials according to the studied population (selected vs unselected patients at risk based on a reduced cuff-leak volume). Each point represents one trial. SE = Standard Error. RR = Relative Risk.