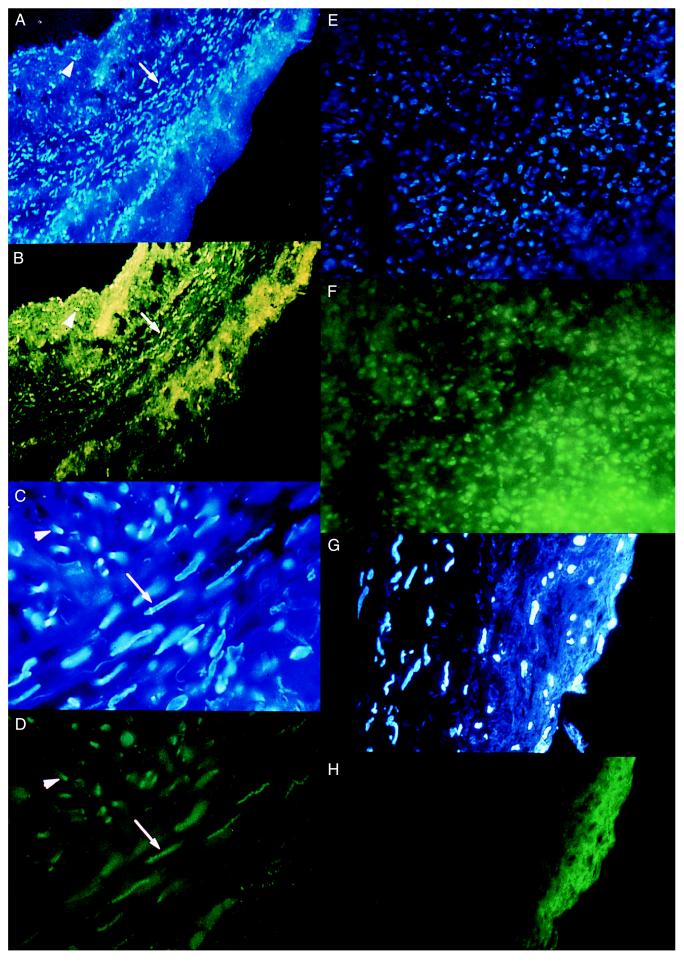
Figure 2.
Nuclear localization of FITC–ODN in human vein and rat heart. Fluorescent photomicrographs indicate concentrated green FITC–ODN signals (A, C, and E) that correspond to nuclei labeled with the blue intercalating chromatin dye, Hoechst 33342 (B, D, and F). FITC–ODN localization is seen in nuclei of the medial (arrow) and intimal (arrowhead) layers in human saphenous vein at ×100 (A and B) and ×400 (C and D) magnification. (E and F) Pressure-mediated FITC–ODN transfection of cells in rat myocardium (magnification ×400). (G and H) Control human saphenous vein pressure-treated with free, non-ODN-conjugated FITC. Note the absence of nuclear localization of FITC signal despite background green fluorescence (magnification ×400).

