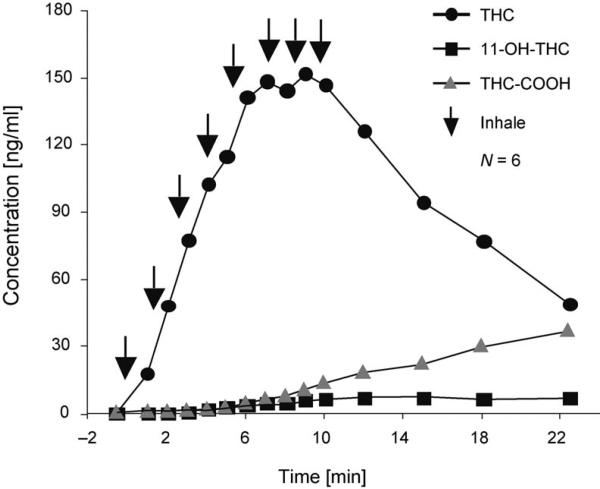
Fig. 1.
Mean (N=6) plasma concentrations of THC, 11-OH-THC, and THC-COOH during smoking of a single cannabis cigarette containing 3.55% of THC. Arrows (↓) indicate one inhalation or puff on the cannabis cigarette. Reprinted and adapted with permission by Springer-Verlag, ‘Handbook of Experimental Pharmacology’, 2005, p. 660, Fig. 1.

