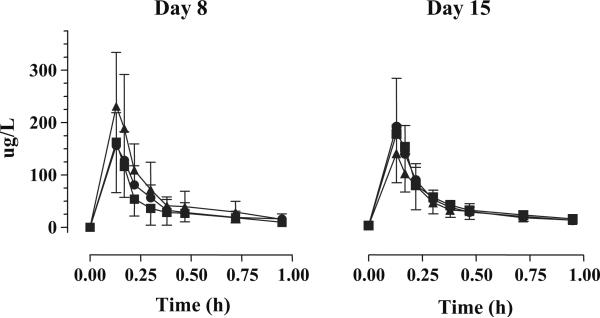
Fig. 2.
Δ9-Tetrahydrocannabinol (THC) plasma pharmacokinetic profiles for 75 min after smoking of a 2.78% THC cannabis cigarette by 33 adult men. Each symbol is the group mean of plasma THC concentrations (n=11 for each dose group). Triangle placebo rimonabant daily, square 40 mg rimonabant daily for 15 days, circle 90 mg rimonabant day 15 only (placebo on days 1−14). Vertical bars indicate standard deviation

