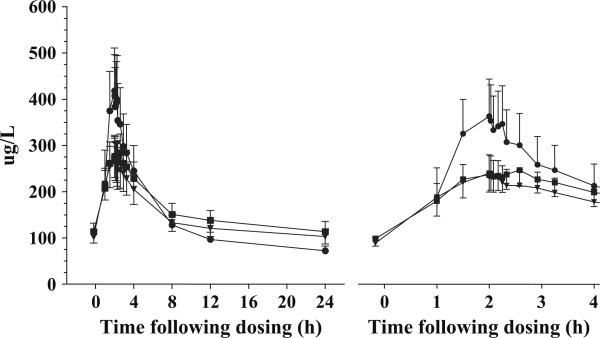
Fig. 3.
Rimonabant plasma pharmacokinetic profiles for 24 h (left panel) and 3 h (right panel) after oral rimonabant dosing. Each symbol is the group mean of plasma rimonabant concentrations (n=11 for each dose group). A cannabis (2.78% THC) cigarette was smoked 2 h after rimonabant dosing. Inverted triangle 40 mg daily rimonabant, day 8, square 40 mg daily rimonabant, day 15, circle 90 mg rimonabant day 15 only (placebo on days 1−14). Vertical bars indicate standard deviations

