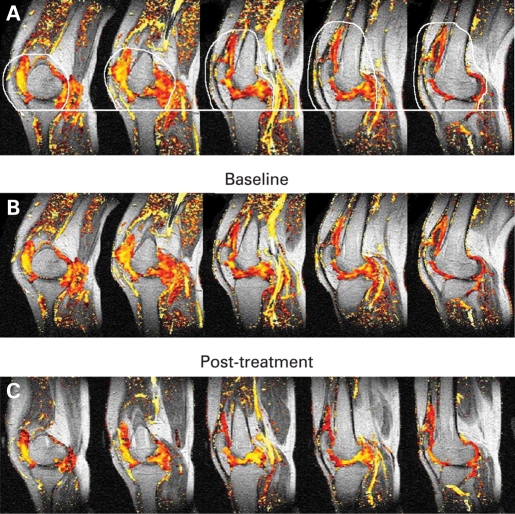
Figure 4.
Five characteristic dynamic gadolinium-enhanced magnetic resonance imaging sagittal scans acquired from the knee with superimposed colour data showing values of initial rate of enhancement (IRE) across synovial space following gadolinium enhancement—pixels shown in yellow represent high IRE values whereas red show relatively lower values. Image (A) shows global region of interest outlined in white, which defines the extent of the synovitis at a level of 10 pixels below the tibial plateau to the top of the suprapatellar pouch, avoiding enhancement from muscle and arteries in each of the five sagittal images. Images (B) and (C) are an example of pre and posttreatment, respectively.

