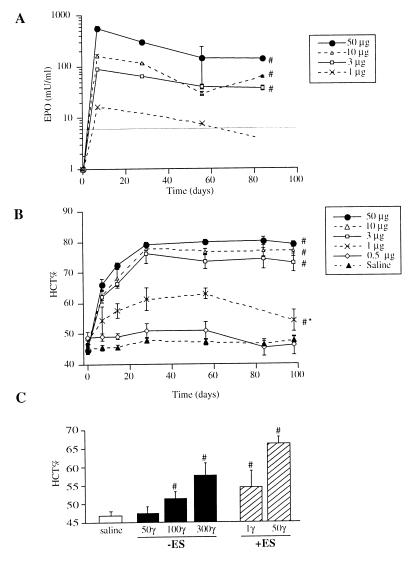
Figure 2.
(A) Serum EPO levels in BALB/c mice injected with different amounts of pCMV/EPO. The horizontal line indicates the limit of detection of the assay. (B) Hematocrit levels. (C) Comparison of hematocrit levels in mice injected with different DNA doses with (+ES) or without (−ES) electrostimulation. Data are the mean ± SD of hematocrit and serum EPO measured in five animals. #, Significantly different from the saline control; ∗, significantly different from 50 μg.

