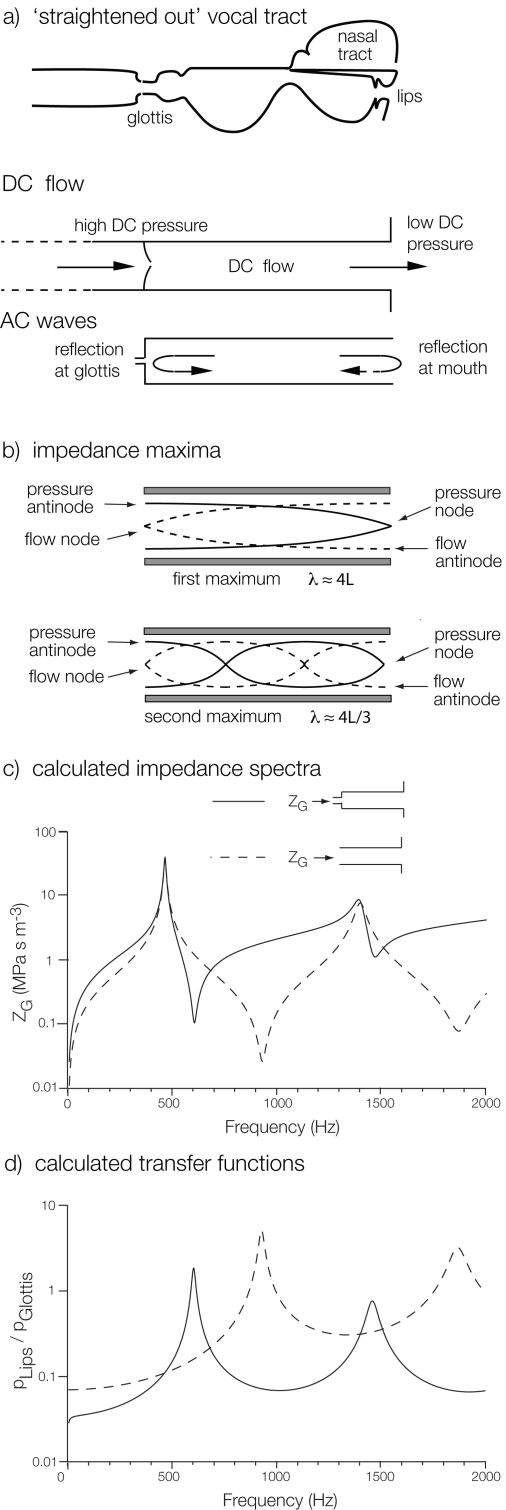
Figure 1. Simplified vocal tracts.
In the sketch in (a), the vocal tract has been “straightened out” to show the effects of dc and ac flows. (b) shows the modes of vibration in a simple pipe leading to impedance maxima measured at the left hand end. (c) shows the theoretical calculations for the magnitude of the input impedance and (d) a transfer function for a cylindrical “vocal tract” of length=170 mm and radius=15 mm (dashed line). The variation is large, so both vertical scales are logarithmic. The continuous line includes the effect of a model “glottal” constriction: a cylinder with a radius of 2 mm and an effective length (including end effects) of 3 mm.

