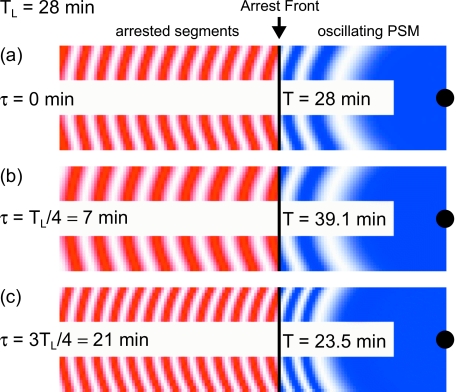
Figure 3. Numerical simulation of segmentation using Eq. 1 in a growing two-dimensional geometry.
Color intensity indicates the value of sin θ of the phase θ: white is sin θ=1 and dark (red or blue) is sin θ=−1. Vertical line indicates the position of the arrest front, with the oscillating PSM to its right (blue) and the arrested pattern to the left (red). Intrinsic frequency is a decaying function of the distance to the black dot at the posterior boundary, causing the curvature of the stripes. Open boundary conditions are used in the lateral borders: no coupling is considered to cells outside the simulated geometry. We have used parameters determined for zebrafish at 28 °C, see Table 1, and ωL=0.224 min−1, see main text for details. We have chosen to display three illustrative values of the time delay (a) τ=0 min, (b) τ=TL∕4≈7 min, and (c) τ=3TL∕4≈21 min. Delayed coupling affects the collective frequency of oscillations according to Eq. 5. The stripes of the oscillating PSM pattern and the segment length of the frozen pattern change accordingly. Movies available as Supplementary Material.

